

Ask ten sales managers to describe their book of business and you will get ten spreadsheets, ten different color-coded systems, and roughly zero shared understanding of where the real opportunity sits. A tree map fixes that in one comprehensive solution.
What is a tree map?
A tree map is a data visualization that represents your customer base as a set of rectangles. Each rectangle is sized by one metric that matters, such as volume, revenue, or growth potential, and is colored by a second metric, such as performance against target. The bigger the box, the bigger the account. The color tells you whether that account is thriving, flat, or slipping.
A spreadsheet ranks accounts top to bottom, but it does not show scale. A customer ranked number 20 in current year sales could have twice the total sales potential of number 8 and you would have to add more columns to your list to identify appropriate metrics. A tree map makes size and status visible at the same time, so a manager can spot a large underperforming account in the time it takes to glance at a screen.
How BIG Consulting uses tree maps in ag retail business intelligence
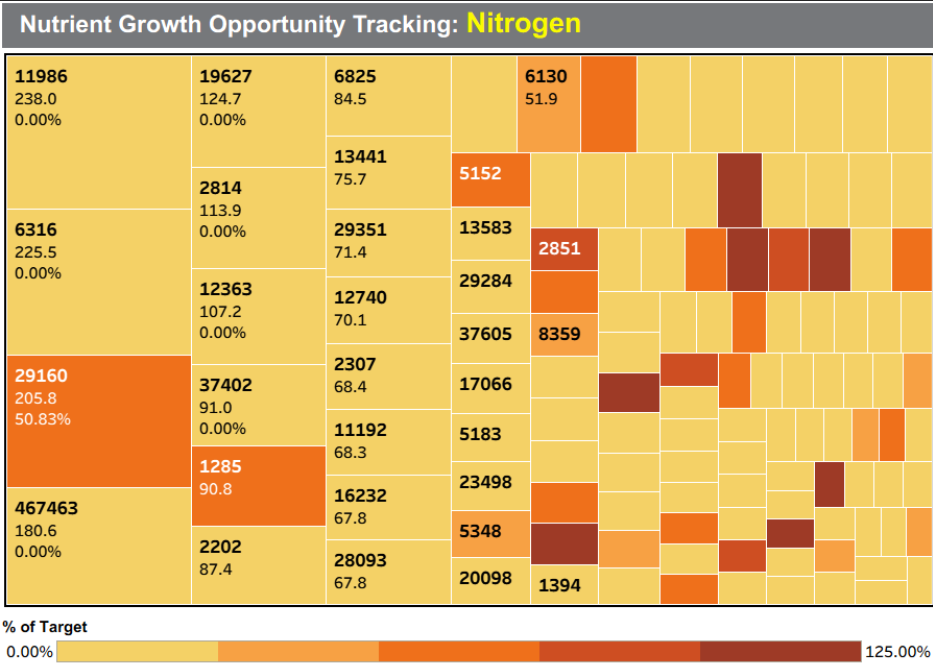
BIG Consulting’s Nutrient Growth Opportunities dashboard uses tree maps to display an ag retailer’s full customer base, with each rectangle sized by Target Nutrient volume and colored by how much of that target the customer has purchased so far in the current year. Colors run from yellow (less than 25% of target) through shades of orange, making it immediately clear which accounts need attention.
Working with a large Midwest agricultural cooperative, this approach surfaced these 123 customers who had purchased just 354 tons of nitrogen combined during the previous selling season, representing less than 11% of their average purchases from recent years on record. The tree map quickly identified the “lost tons” customers that were completely invisible in standard sales reporting. The tree map made it undeniable and illustrates progress on regaining lost tons at a quick glance.
Instead of opening a coaching session with “let’s review your accounts,” a manager can point to a single oversized yellow rectangle and ask, “what is going on with this one?” The conversation starts at the opportunity.
Frequently asked questions
What data do you need? At minimum, four years of customer-level purchase history by product. BIG Consulting’s process also factors in crop rotation variances to calculate a Target Nutrient volume for each customer.
Do tree maps work beyond agronomy? Yes. BIG Consulting applies the same approach for grain originators tracking bushel volumes and energy retailers monitoring propane, diesel, and gasoline gallons.
Can tree maps be filtered by salesperson? Yes. Every visualization in BIG Consulting’s dashboard, including the tree map, can be filtered to display only the accounts assigned to a specific rep.
Ready to Learn More
If your team is still managing opportunity by exporting reports and eyeballing columns, a tree map is one of the fastest ways to change how those conversations happen. Contact our team today to see what your customer data looks like as a tree map.