

Your batching system says everything looks fine. Variance is minimal. The summary report indicates your ingredient totals are within range. On paper, feed manufacturing quality control has never been better.
But summary reports only tell part of the story. What they cannot show you is what happened in batch 47. Or batch 62. Or the 18 batches last week where a single ingredient consistently came in over the target amount and exceeded the acceptable tolerance level. Not enough to move the aggregate numbers, but enough to affect the quality of several loads that left your facility.
That is the gap between knowing your averages and knowing your process.
What conventional reporting misses
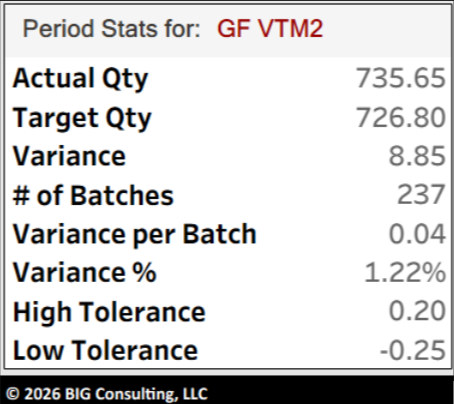
Most batching systems report ingredient accuracy the same way: aggregate totals over a given time period such as those listed in the chart below. When those numbers look good, operations managers move on.
The problem is that aggregated data can mask significant batch-level issues. Overages and shortages offset each other in the totals, producing a clean summary while individual batches may be significantly out of tolerance. By the time a pattern becomes visible in the aggregate, it may have already been running for days.
Feed manufacturing quality control requires visibility at the batch level, for every ingredient, not just a summary of how things averaged out.
What ingredient-level precision looks like in practice
BIG Consulting built Precision Feed Manufacturing (PFM) to address this gap. PFM pulls data directly from your existing batching system and transforms it into visualizations that show exactly what was mixed in every batch, compared to the predefined target for every ingredient.
Not averages. Not summaries. Every batch. Every ingredient. Like this:
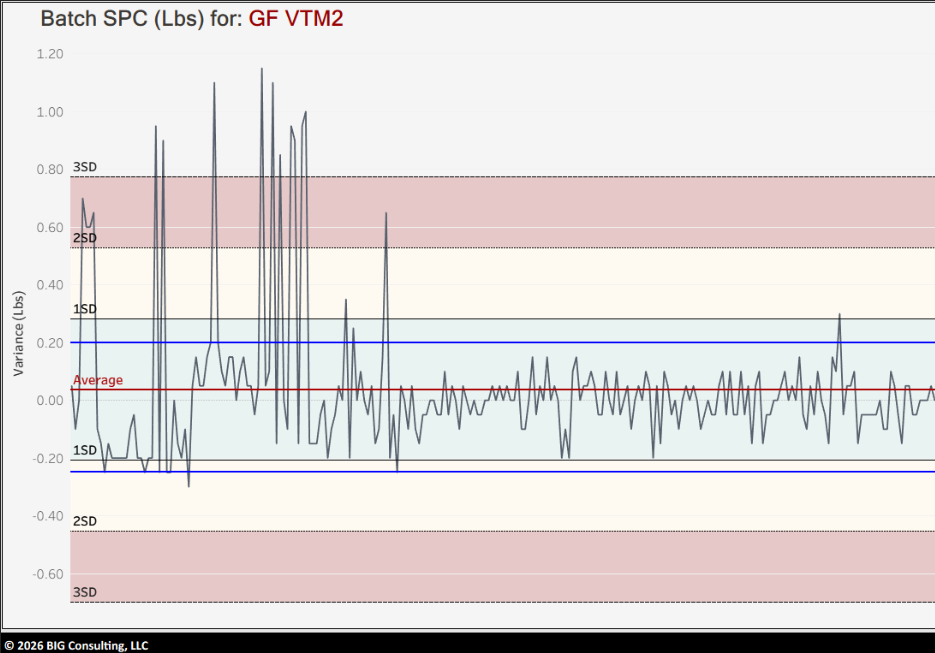
Note: In the example above, the High Tolerance was exceeded 18 times – 15 of which were 3-5X acceptable levels of variance!
When a pattern exists – an ingredient consistently running low at certain inclusion rates, a pump performing differently across shifts, or a calibration drift too gradual to trigger an alarm – PFM surfaces it visually before it becomes a quality or compliance problem.
This matters beyond quality alone. Overuse of expensive ingredients represents a direct and often invisible cost that aggregate reporting rarely captures. Consistent underuse creates nutritional gaps that affect animal performance. PFM makes both visible.
Compatible with the systems you already run
PFM integrates with five of the most widely used batching systems in the industry: Beta Raven, Easy Automation, Interstates, Repete, and WEM. PFM connects to your existing system and delivers visualizations your operations team can start using immediately.
The question worth asking
If your current reporting tells you how things averaged out but not what actually happened in each individual batch, there is a level of precision available to you that you are not yet using.
Ready to see what your batching data is actually telling you? Contact our team today and we will show you what PFM can surface in your facility.