

If your annual fertilizer sales report breaks volume into three categories, anhydrous, dry fertilizer, and liquid fertilizer tons, you are looking at the same numbers your auditor looks at. That is a fine starting point for a compliance report. It is an incomplete foundation for building a growth strategy.
Ag retail business intelligence requires a different kind of metric. One that reflects what value your customers actually received, not just what product category moved off your books. And for fertilizer retailers, that means measuring results by nutrient tons, not product tons.
The problem with product-category reporting
Walk into almost any agricultural cooperative and ask to see year-over-year fertilizer performance. Odds are good that you will get a spreadsheet with three rows: anhydrous, dry, and liquid. Volumes in tons. Maybe a variance column.
What that report cannot tell you is whether you are actually delivering more or less nitrogen, phosphorus, and potassium to your customers than you were three years ago. A shift from one product formulation to another – DAP to MAP for instance – changes the nutrient content of every ton you sell, even if the tonnage looks identical on paper. That gap between what the product tonnage report shows and what is happening in the field from nutrients delivered is exactly where ag retail business intelligence makes a measurable difference.
Converting product tons to nutrient tons: A better way to measure progress
The approach we use at BIG Consulting starts with a straightforward but powerful reframe: convert every fertilizer product you sell into the actual tons of nutrients delivered to the customer.
Take MAP as an example. If you sell 8,000 tons of MAP in a year, the product ton report shows 8,000 tons of dry fertilizer. But what your customers actually received was 880 tons of total nitrogen and 4,160 tons of total phosphorus. Those are the numbers that tell the real story of your market penetration.
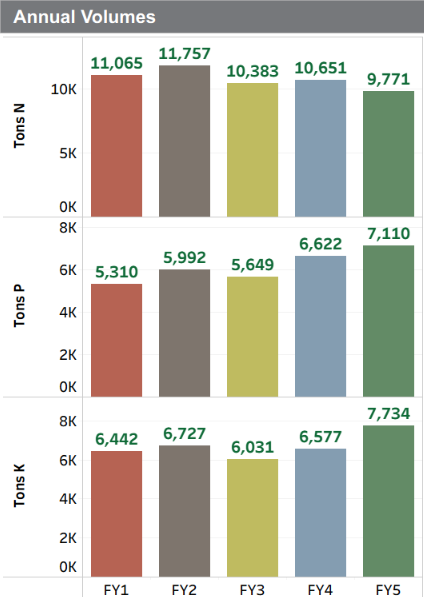
This image on the left shows what a nutrient ton analysis looked like for one of our clients, a large Midwest ag cooperative, across five fiscal years:
Phosphorus and potassium are trending up, while nitrogen is trending down. That is immediately actionable information. And it only becomes visible when you stop reporting in product tons and start reporting in nutrient tons.
What this means for your sales strategy
Once you have the right metric in place, ag retail business intelligence stops being a reporting exercise and starts being a selling tool.
In the example above, the nutrient ton view made it clear that nitrogen was an area of opportunity. The retailer was not necessarily losing fertilizer customers across the board; they were losing nitrogen volume specifically, with phosphorus and potassium holding steady or growing. That distinction changes who your sales team calls, what they talk about, and how they frame the conversation.
Without the nutrient ton framework, that pattern stays buried in a category-level report that shows aggregate fertilizer tons trending within a normal range. Nothing to act on. With it, you have a focused, data-driven priority for the selling season.
A note on product complexity
One reason this conversion is rarely done is the sheer complexity of modern fertilizer product catalogs. A single retailer might carry dozens of SKUs across multiple units of measure: tons, gallons, pounds, 50-pound bags, etc. Each product has a different nutrient composition. Normalizing all of that into a consistent, comparable metric by hand is time-consuming enough that most organizations never attempt it.
This is precisely where ag retail business intelligence technology earns its value. The conversion logic, once built, runs automatically. Every product is converted to its nutrient content, which can be expanded beyond just NPK to other nutrients like Sulfur. Every sale flows into a dashboard that gives sales managers a real-time view of nutrient delivery trends at the customer level, the salesperson level, and the organization level.
The bottom line
Your fertilizer sales data is telling a more detailed story than your current reports are capturing. Shifting from product category tons to nutrient tons is not a cosmetic change to your reporting. It is a foundational shift in how you measure progress, identify opportunities, and direct your sales team’s attention.
If your ag retail business intelligence strategy is still built on the same three-row auditor report it has always been, it may be time to ask what your data is not showing you.
Curious what your nutrient ton numbers actually look like? Reach out to us here and we will show you what your data is telling you.